Method — Foundation Forensics — ASCE Level B Documentation
Foundation Forensics Open the platform Get started

What it does for the person holding it

It raises the standard you work to — and that is what earns the trust.

Homeowners do not decide who to believe by weighing arguments. They decide by whether they can follow what they were told. An inspector who can show the measurements, name the method, and say plainly where their opinion stops is believed. One who insists is not.

Your standard

  • You work to a published method. ASCE Texas Section, Version 3 — not house style. Anyone can check what you did against a document you did not write.
  • Your instrument is on the record. Make, serial, calibration date, stated accuracy, on every report. A reading with provenance is a measurement; without it, it is an anecdote.
  • Your numbers are derived, not typed. Deflection, tilt, severity and slope are computed from the points you took. Nothing on the page is a judgement call you have to defend from memory.
  • Your work compounds. Every property becomes a baseline. Six months on, you are not guessing whether it moved — you are measuring how fast.

Their trust

  • They can see it. A colour-coded map of their own floor plan, with the number at each point. Nobody needs training to understand which corner is low.
  • They can read it. Part II is written in plain language — what was found, why it matters, what to do next, in order.
  • They can check you. The report says what it does not conclude, and who is licensed to. A professional who names their limits is the one people believe about everything else.
  • They can forward it. To a spouse, an engineer, an insurer, a second opinion. It holds up away from you, which is the only real test of a document.
You did the same walk you always do. The difference is that now it is written down in a form that survives the next person who reads it.

The report carries your firm, your licence number and your professional opinion. The software formats and computes — the judgment on the page stays yours, and the limits it states are what make the rest of it credible.

Where the line is

Built to stop exactly where your licence does.

Texas draws two hard lines through this work — one at the practice of engineering, one at the adjusting of insurance claims. Crossing either is not a technicality. This document is shaped so that what you hand a homeowner is measurement and record, and so the calls that are not yours to make are routed to the person licensed to make them.

The opinion you are required to give — with a method behind it

A TREC inspector must “render a written opinion as to the performance of the foundation” — 22 TAC § 535.228(a). The Standards of Practice prescribe no method for reaching it: elevation surveys, deflection and tilt appear nowhere in the rule. The one opinion the state requires of you is the one it leaves you to justify alone. This gives it a measured, repeatable basis you can put in front of anybody.

Cause and repair belong to a P.E. — and the report says so itself

TBPELS Policy Advisory Opinion 43 holds that a visual performance opinion “does not engage in the practice of engineering” — but that “analyzing the cause of a condition, recommendations for repair… would be considered the practice of engineering”, under Tex. Occ. Code Ch. 1001. The document records measured condition and hands cause and repair to a licensed engineer, in its own text, on the page — where a reader can see the handoff.

Documentation is not adjusting a claim

“A contractor may not act as a public adjuster or advertise to adjust claims” — Tex. Ins. Code § 4102.163(a). Violation is a Class B misdemeanor (§ 4102.206), and the customer’s contract becomes voidable with nothing owed for work already performed (§ 4102.207). The Texas Supreme Court upheld both provisions in TDI v. Stonewater Roofing on 7 June 2024. A measured record of what a structure is doing is documentation — it is what you produce instead of an opinion about the claim.

It is the evidence that travels

Under the Residential Construction Liability Act a claimant must produce “any expert reports, photographs, and video or audio recordings” that would be discoverable — Tex. Prop. Code § 27.004(a). Whatever you wrote becomes part of that file whether you intended it to or not. A document carrying its instrument, its calibration date, its raw readings and its arithmetic survives that journey. A one-line note on a work order does not.

And what it is not — said plainly, because your competition will not say it

This is not a state-approved or state-certified document, and no Texas law requires it. The ASCE Texas Section guidelines are a voluntary professional-society methodology; the document says of itself that its guidelines “are not intended to be Standards”. The terms Level A and Level B come from that guideline and appear in no Texas statute or rule. Anyone selling a “state-certified foundation report” is selling something that does not exist. What this is: the methodology Texas engineers actually use for residential foundations, applied the same way every time, with every number traceable to the reading it came from.

What a proper inspection is worth

Trust is the thing that closes the job.

A homeowner deciding between three contractors is not comparing methodologies. They are deciding who they believe. The measured, readable, self-limiting document is not a nicer deliverable — it is the reason they pick you, and the reason they call you back in six months instead of somebody else.

01They understand what you found

A colour-coded map of their own floor plan with a number at every point. Understanding is what converts into agreement — nobody signs for work they cannot picture.

02They can check you, and that is the point

The report names its method, logs the instrument, and states what it does not conclude. People trust a professional who marks their own limits more than one who has an answer for everything.

03You are right the first time

The survey that finds the low corner is the one that does not come back to haunt you. Being wrong about "minor" is how a customer relationship ends.

04The relationship keeps going

Every property becomes a baseline. A monitoring visit six months on is a reason to return, a second measurement that means something, and a customer who already trusts you.

The part nobody talks about

You finished the inspection at four. You finished the report at nine.

The inspection isn't the hard part. You've walked a thousand slabs — you knew what was happening before you got the level out. The hard part is turning what you saw into documentation that holds up when the homeowner, the adjuster, or the next contractor reads it.

How it works

Three steps, start to signed PDF.

STEP 01

Walk the job like you always do

Photos, elevation readings, notes on your phone. Nothing new to learn, no new gear to buy.

STEP 02

Enter what you measured

Point by point, with your observations. Calculations run live against residential thresholds as you go.

STEP 03

Get a finished report back

Findings, severity, and recommendations — formatted and ready to send to the homeowner.

Open it yourself

A worked evaluation, already loaded.

Not a video, not a guided tour. The real application with a complete case already in it — an initial evaluation, a six-month monitoring visit, sample hydrostatic and CCTV evidence attached to specific sewer segments, and § 7.0 comparison computed between the two. Click through every section. Change a reading and watch the numbers move.

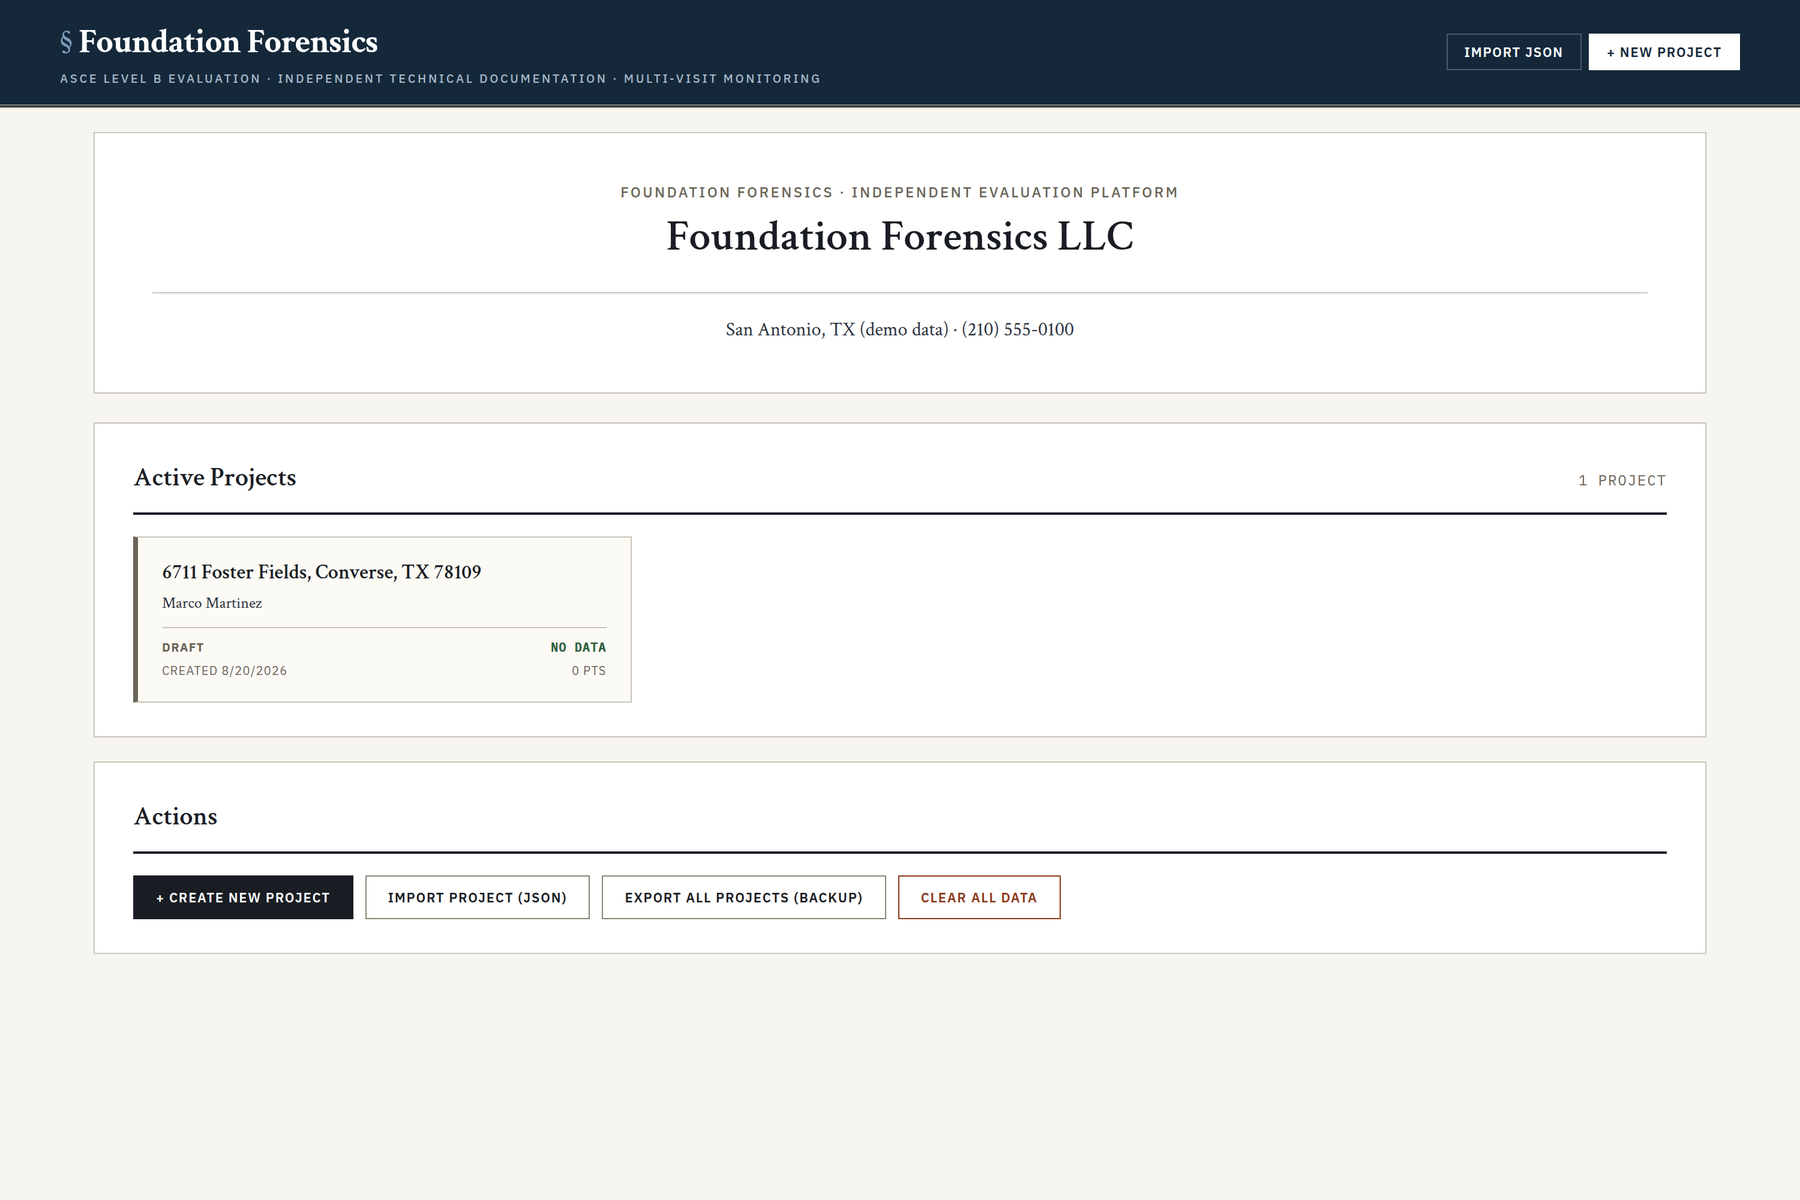
Project dashboard listing properties with address, client, severity and point count.
Dashboard — every property, with its measured differential and status.
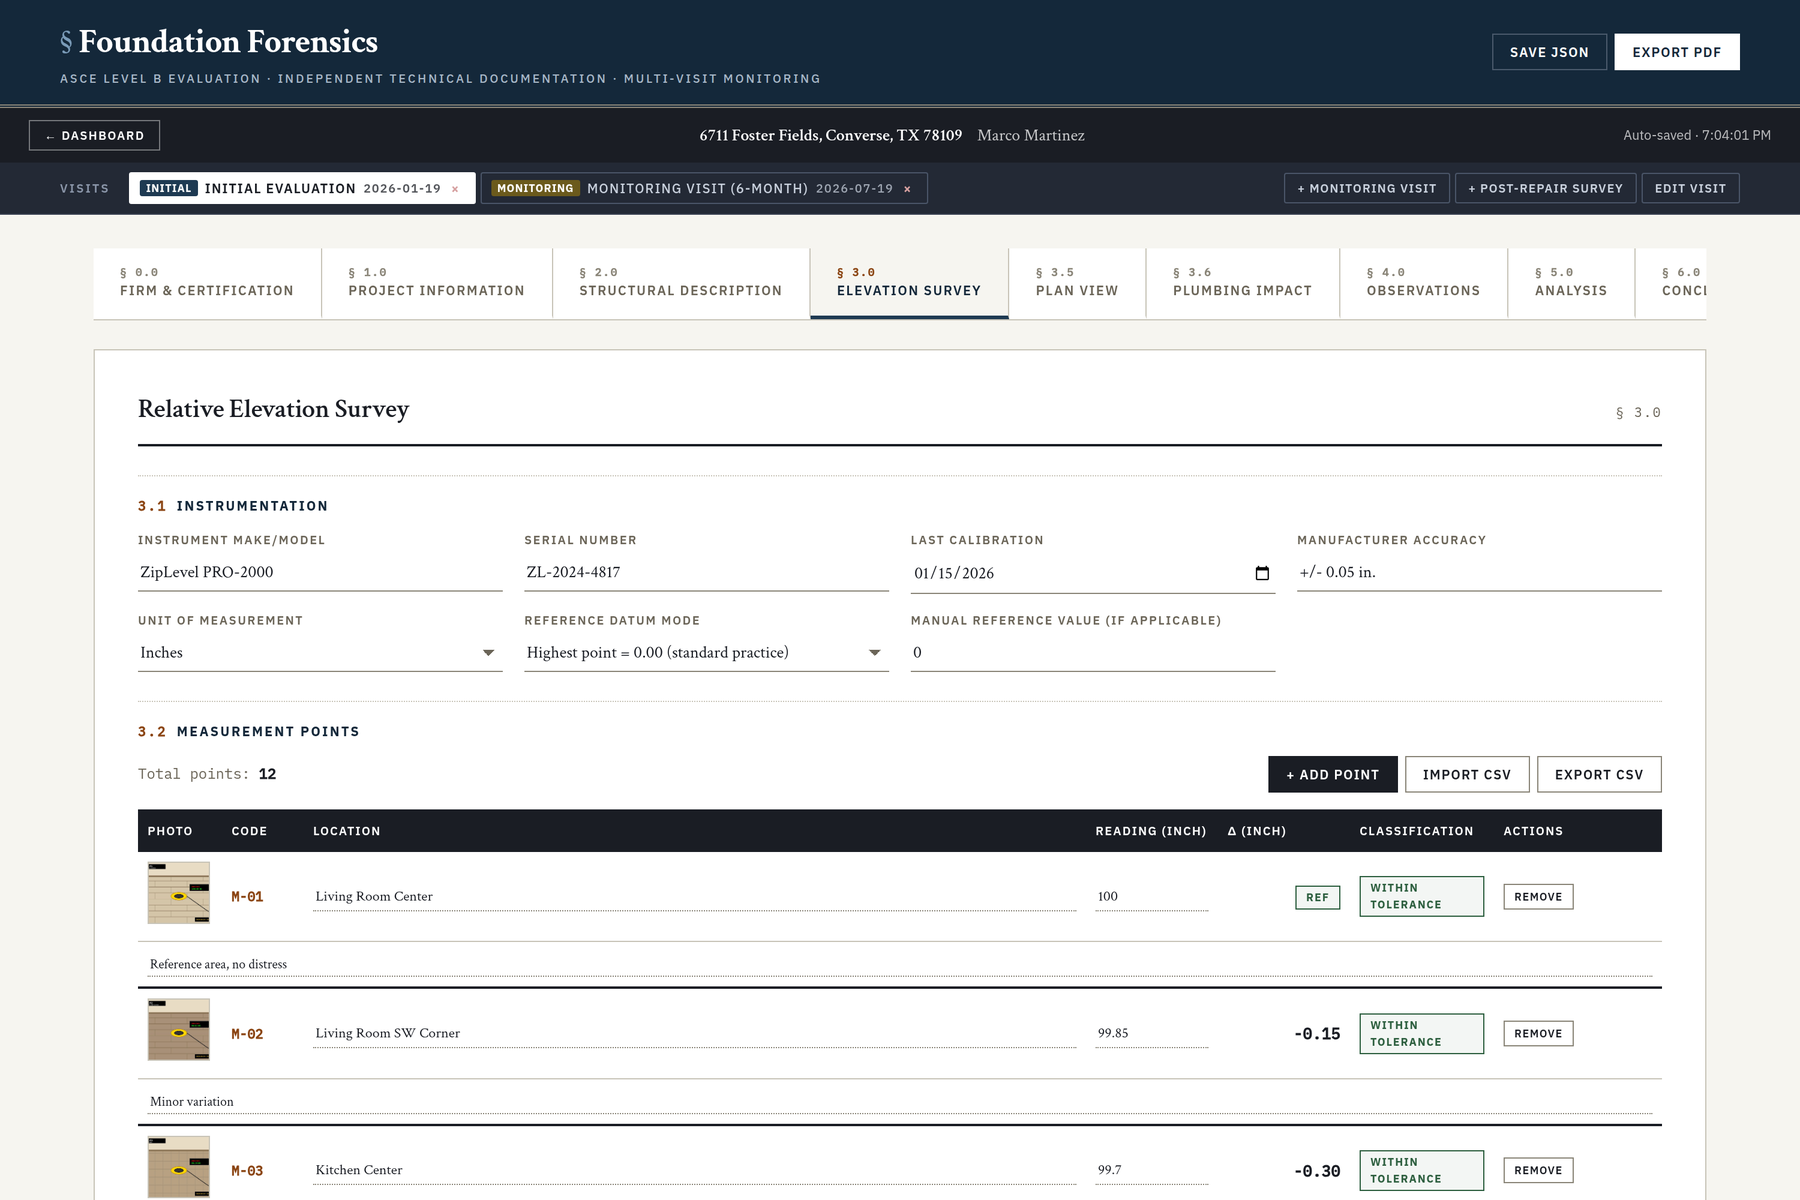
Project view showing the section tabs and the elevation survey grid.
Project view — ten numbered sections down one tab bar.
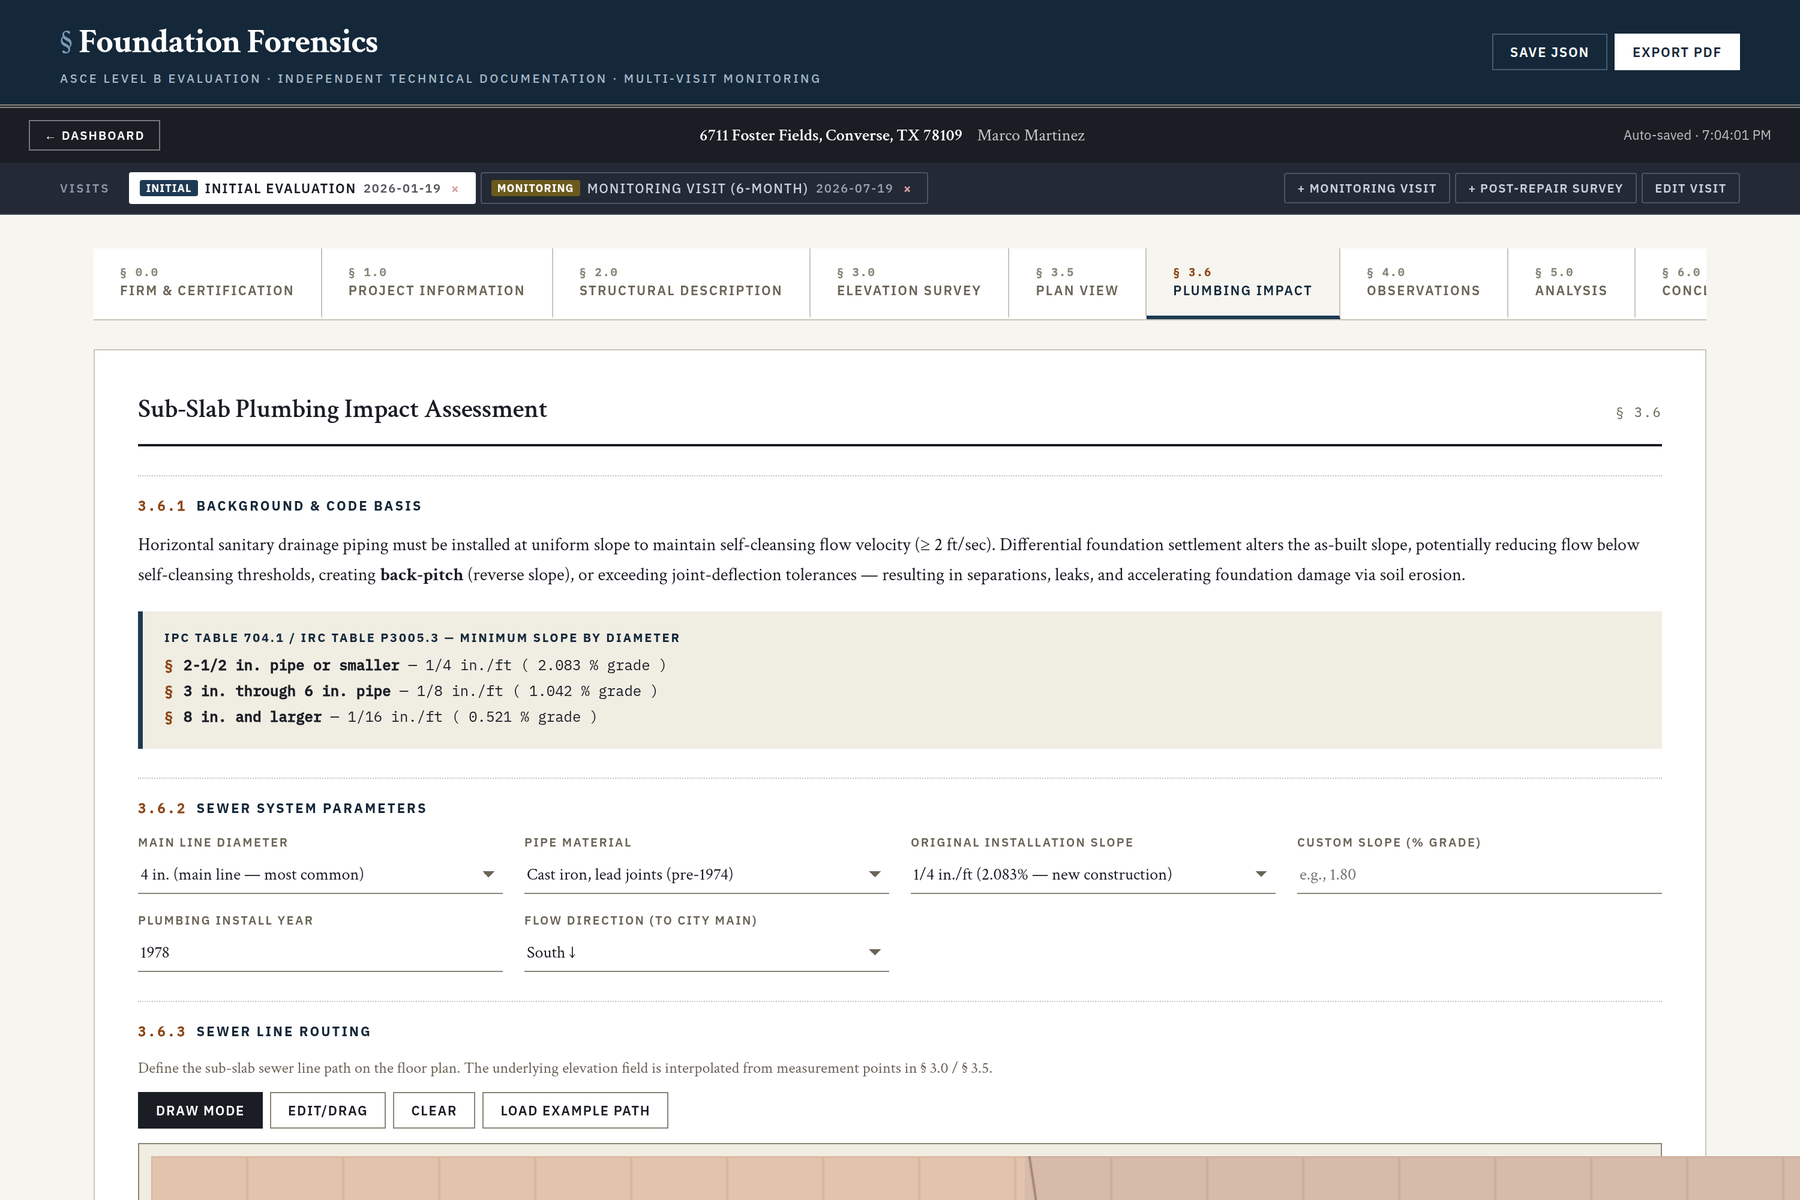
Sub-slab plumbing impact tab with the segment table, joint-stress index and field-test evidence column.
§ 3.6 — segment table, joint-stress index, and the evidence column.

The demonstration uses its own storage key, so nothing you do in it touches a real project. Everything stays in your browser; nothing is sent anywhere.

The same house, four different surveys

The drawing is computed, not chosen.

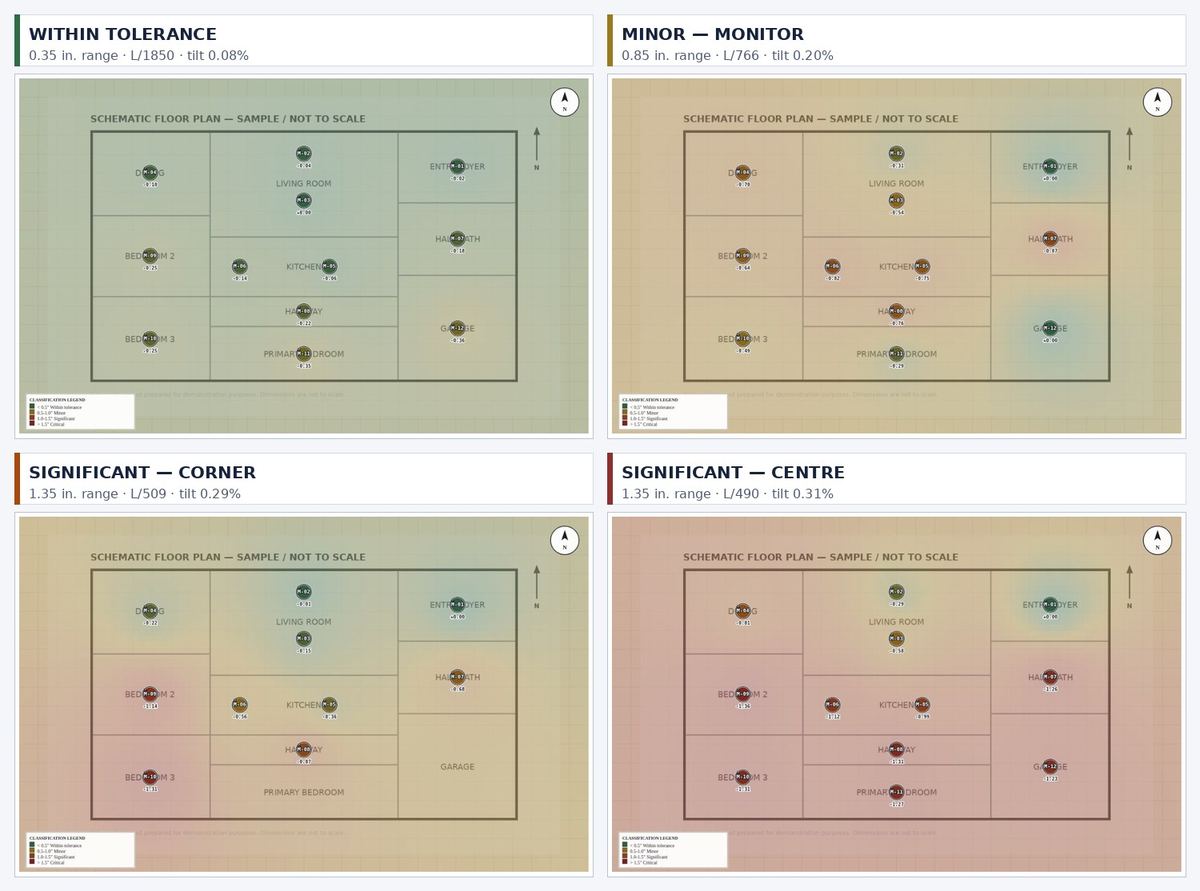
One floor plan. Four sets of readings. The settlement field is interpolated from your points every time, so the picture has to change when the measurements change — there is no library of pre-drawn severity graphics to pick from.

Four heatmaps of the same floor plan generated from four different measurement sets: within tolerance renders green and uniform; minor renders warm; a corner-loaded survey concentrates red in one corner; a centre-loaded survey renders a red band through the middle.
Four reports generated from the same plan with different readings. Classification, deflection ratio and tilt are computed from the points — they are printed under each panel exactly as the engine produced them.
Interpolation

Inverse-distance weighting across every placed point, resampled on a 12 px grid.

Banding

0.5 in. / 1.0 in. / 1.5 in. — the firm's stated convention, named as its own in the report.

Reading it

Green is within tolerance, red is where the slab is low. A homeowner needs no training to see the shape.

Verified, not asserted

Thirty surveys, run end to end.

Before publishing a claim about this tool, we generated thirty complete reports across four settlement patterns, three severity bands, 10 to 18 measurement points, and five pipe material and era combinations. Here is what came back.

30 / 30Reports completedNo failed renders, no missing sections, no placeholder fields left in the output.
10 · 10 · 10Classification tracked the dataWithin tolerance, monitor, and repair-recommended each came back exactly where the readings put them. Nothing drifted.
L/2149 → L/472Deflection responded monotonicallyRatio tightened as differential grew, across every pattern. Tilt moved with it, 0.07% to 0.32%.
15 pagesEvery timeSame structure, same section numbering, whether the finding was "no movement" or "critical".

Figures from our own test run of the shipped engine, August 2026. A report that documents an absence of movement is the one that closes a real-estate transaction — so the within-tolerance case was tested as hard as the critical one.

Inside the report

Eight numbered sections, every figure traceable.

Not a checklist with a photo grid. A structured record — every measurement traceable to a point code, every threshold traceable to a published standard, and a plain-language summary for the homeowner bound into the back.

  1. § 1.0
    Inspection ConditionsSite and client data, the instrument used, weather and temperature at the time of survey, and a scope-of-work paragraph that states what this firm does and does not do.
  2. § 2.0
    Structural DescriptionBuilding type, year, area, construction and cladding; foundation system, perimeter beam, reinforcement, previous work; site conditions, tree proximity, drainage, and the owner's reported symptoms. Then § 2.3.1 — the published soil survey for the parcel.
  3. § 3.0
    Relative Elevation SurveyInstrument, serial number, calibration date, stated accuracy, unit and reference mode — then the full measurement table: code, location, reading, deviation and status for every point.
  4. § 3.5
    Plan ViewThe settlement field interpolated across the floor plan, with 0.25 in. bands, iso-settlement contours and a dashed zero-movement line.
  5. § 3.6
    Sub-Slab Plumbing ImpactPipe diameter, material, original slope and installation year; then per-segment run length, as-designed slope, current computed slope, code status and joint-stress index — with three visual exhibits.
  6. § 4.0
    Visual ObservationsInterior, exterior and drainage findings, each individually coded (I-01, E-01, D-01) so a reviewer can cite one without ambiguity.
  7. § 5.0
    AnalysisMeasurement count, elevation range, deflection with the governing chord named, deflection ratio, overall tilt — followed by the classification and the paragraph explaining which convention produced it.
  8. § 6.0
    Conclusions & RecommendationsMovement finding, contributing factors listed without assigning causal weight, testing recommendations by discipline, and an explicit statement that remedial scope is reserved to a licensed P.E.
  9. § 7.0
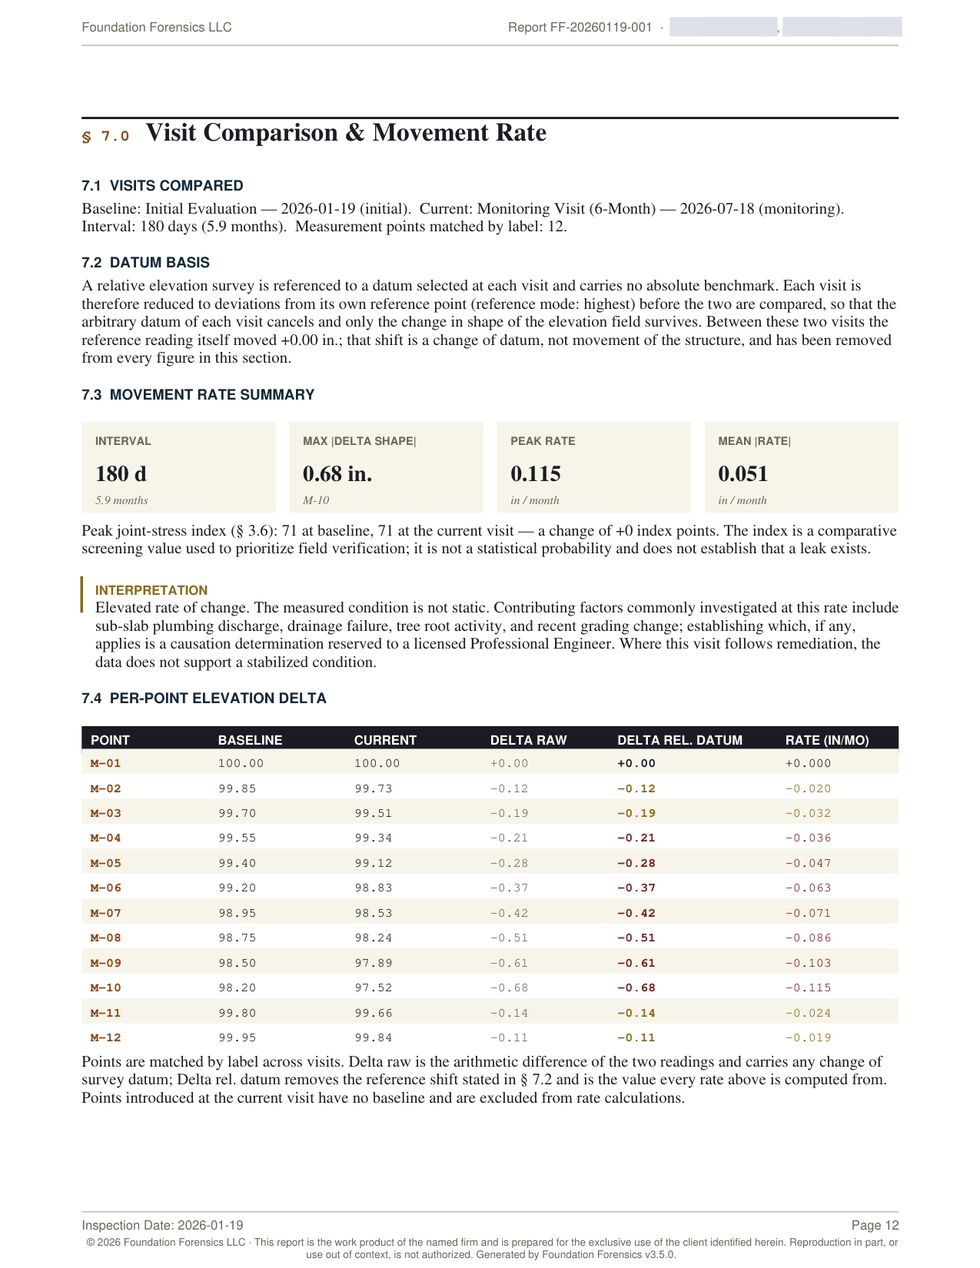
    Visit ComparisonInterval, datum basis, movement-rate summary, and a per-point table of baseline, current, raw delta, datum-corrected delta and rate in inches per month.
  10. § 8.0
    Limitations & CertificationWhat was not inspected, what the survey cannot establish, and the signature block.

Four pages at full size. Click any one to read it.

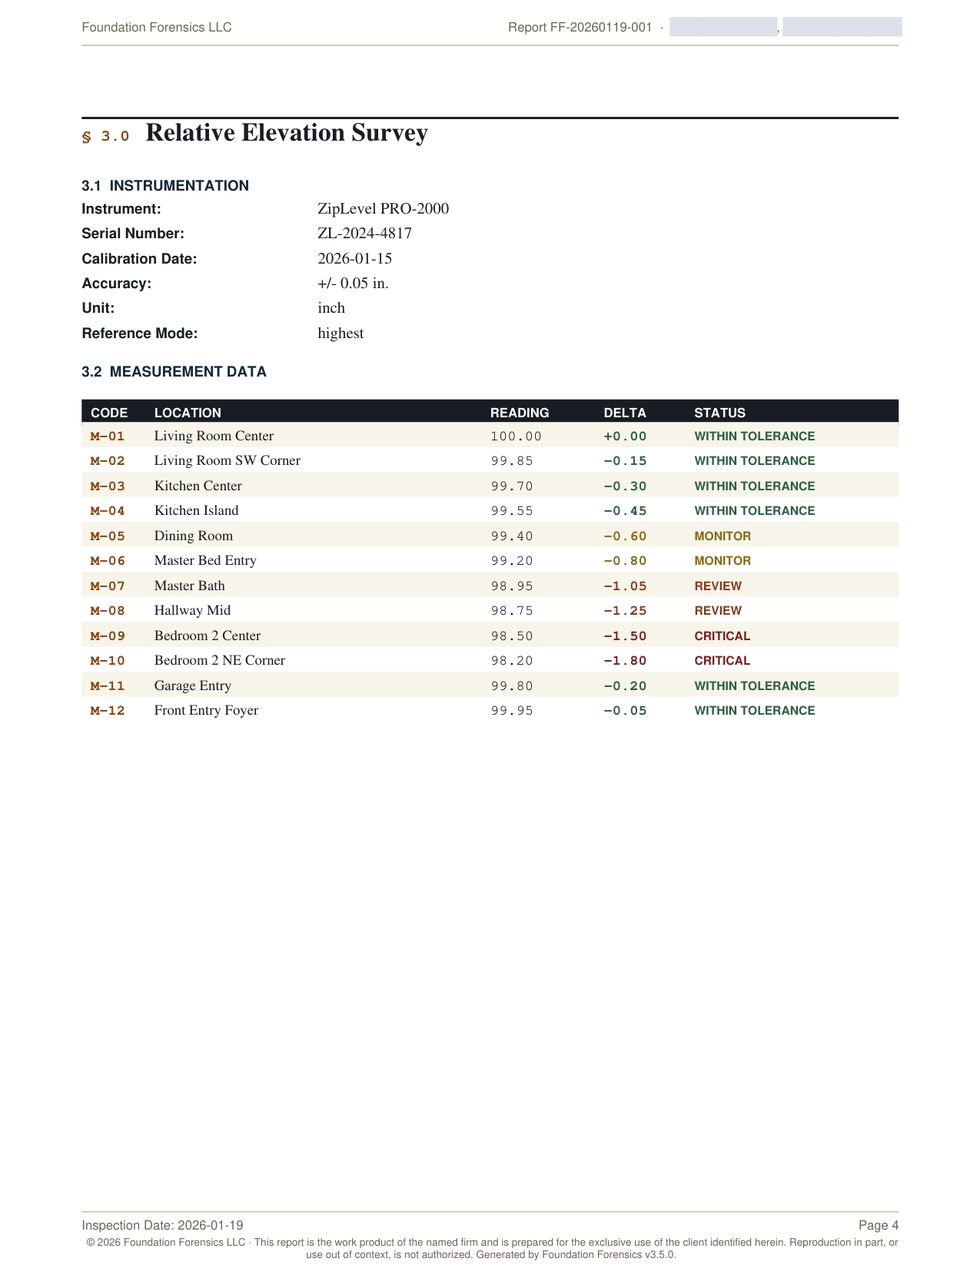
Section 3.0 Relative Elevation Survey: instrumentation block listing instrument, serial number, calibration date, accuracy, unit and reference mode, followed by a measurement table of fourteen points with code, location, reading, deviation and colour-coded status.
§ 3.0 — the measurement table. Instrument, serial and calibration date sit above the data, because a reading with no instrument history behind it is an anecdote. Every point carries a code, a location, the raw reading, the deviation from reference, and a status. The status colour is derived from the deviation, not typed in.
Section 5.0 Analysis: summary metrics for measurement points, elevation range, deflection, deflection ratio and overall tilt, followed by the classification of measured condition and the explanation of the banding convention.
§ 5.0 — the arithmetic, with its method shown. Deflection ratio is computed to the ASCE § 5.4 chord definition and the governing triple is named. Tilt is reported separately, from a least-squares best-fit plane. The banding that turns those numbers into a classification is disclosed as this firm's own convention — not presented as a criterion from the guidelines.
Section 7.0 Visit Comparison: interval and datum basis, movement rate summary cards, and a per-point table showing baseline, current, raw delta, datum-corrected delta and rate in inches per month.
§ 7.0 — the section that wins arguments. One survey says a house is out of level. Two surveys say whether it is still moving, and how fast. The datum shift between visits is subtracted in its own column, so a change of survey reference can never be mistaken for structural movement.
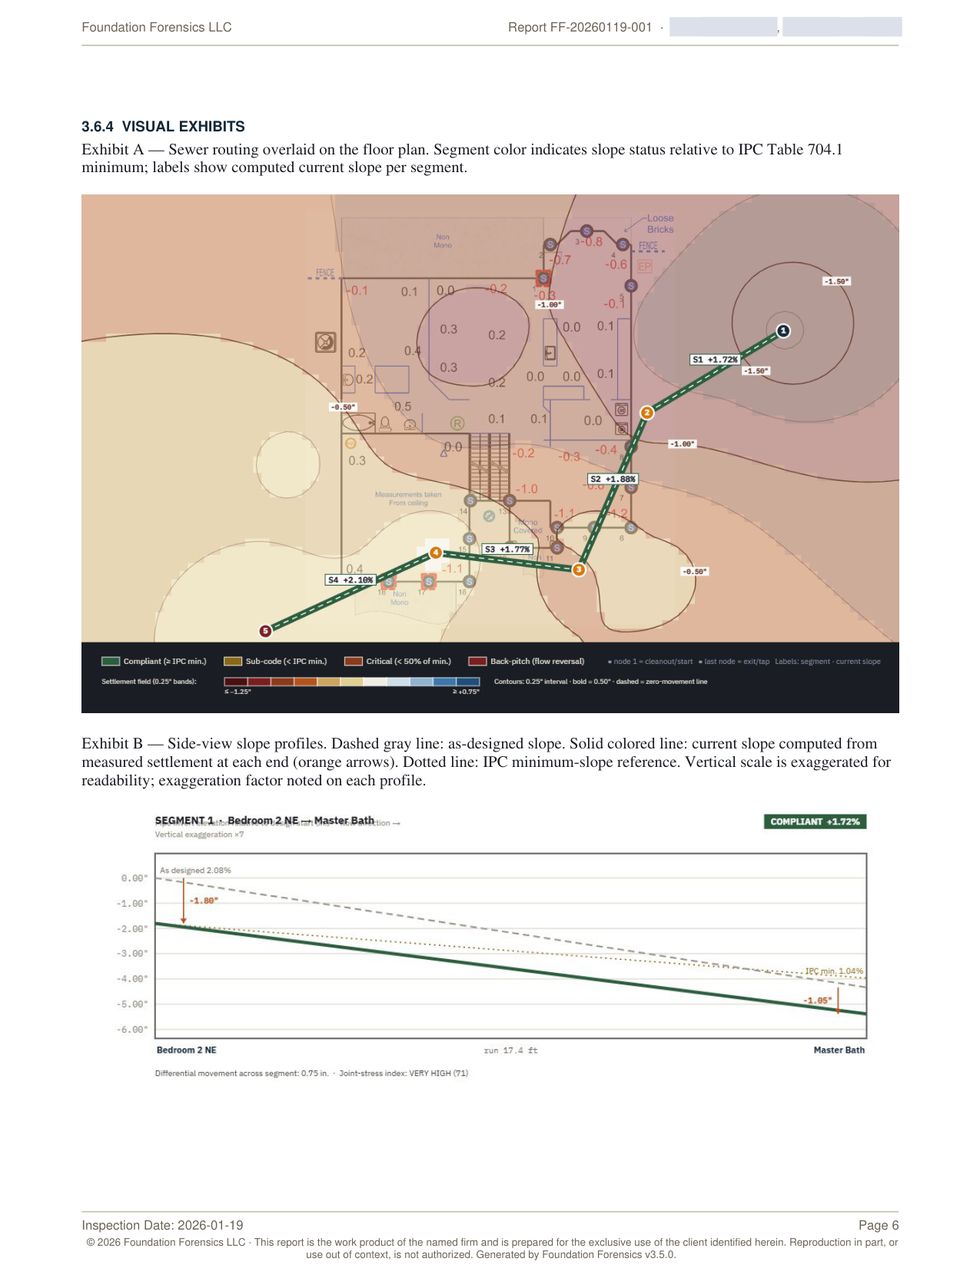
Section 3.6.4 visual exhibits: the sewer routing overlaid on the settlement field with per-segment slope labels, and side-view slope profiles comparing as-designed slope, current slope and the IPC minimum.
§ 3.6 — where the plumbing meets the slab. The traced sewer run drawn over the measured settlement field, each segment coloured by its slope status against the IPC minimum and labelled with the computed current slope. Below it, side-view profiles with the exaggeration factor printed on each one.

Real generated output from a real inspection. The address, the owner and the inspector have been permanently removed — from the image pixels and from the PDF text layer both, using true redaction rather than drawn boxes. Everything else is exactly as the engine produced it.
What gets computed

Numbers a reviewer can check.

L/618Deflection ratioWorst governing triple, searched across every plan-located pair — with the search convention stated in the report rather than assumed.
0.31%Overall tiltBest-fit plane through all points, reported separately from deflection because tilt is rigid-body rotation, not bending.
71Joint-stress indexPipe material and joint tolerance against measured differential — a screening value for prioritising field verification, never a probability.
0.115in/moPeak movement rateRe-survey against baseline over a 180-day interval, with the datum shift removed so only the change in shape survives.

Figures shown are from the sample report above.

§ 3.5.2 — the step most tools skip

Every length on the plan is an assumption until you calibrate it.

Floor plans upload at whatever resolution they happen to be. Until the tool knows how many pixels make a foot, every derived length — sewer segment runs in § 3.6, the deflection span in § 5.2, and every slope computed from them — rests on a guess. Most software never asks. This one refuses to pretend.

01Pick two points far apart

The longer the baseline, the smaller the error it carries into everything downstream.

02Enter the on-site distance in feet

One tape measurement, taken once per property.

03The status line shows the result

Pixels per foot, and the building envelope that implies. If the envelope does not match the footprint, the points were wrong.

04Until then it says so

§ 3.5, § 3.6 and § 5.1 all print "assumed scale" rather than presenting a guess as a measurement.

On the bundled demonstration, calibrating from the 20 px/ft default to the measured 13.44 px/ft moves the deflection ratio from L/281 to L/419 — across a classification boundary.

That is the difference between a report that says "repair recommended" and one that does not. It is one tape measurement.

Three kinds of visit

One survey is a snapshot. Three is an argument.

A single inspection cannot tell a seasonal drift from active movement — and that distinction is what an adjuster, an engineer and a judge actually want to know. Every project holds an unbounded series of visits, and the point grid carries forward so the same labels are re-measured every time.

Initial

The baseline

Full survey, plan placed, scale calibrated, sewer traced. Everything downstream is measured against this.

Monitoring

Six months later

Point labels and positions copy forward; readings clear for re-measurement. § 7.0 computes interval, per-point delta and rate in inches per month, with the datum shift removed in its own column.

Post-repair

Did the work hold?

Near-zero movement documents stabilisation. Continued movement documents remediation failure — with numbers, against the original baseline. It is called a Survey, never a Certification.

Points introduced at a later visit are shown but excluded from rate calculation, because a point with no baseline has no rate. The report says so rather than quietly averaging it in.

§ 6.7 — the handoff

The engineer gets the numbers, not a picture of them.

A licensed P.E. asked to issue a sealed opinion should not have to re-survey the property or retype your table. One button emits the underlying data as CSV, wrapped in a header that names the property, the firm and the inspector — and states outright that no engineering opinion is asserted in the file.

ELEVATION_GRID.csv

Every point from every visit — visit id, date, type, label, plan position, elevation, notes.

PLUMBING_SEGMENTS.csv

Every segment from every visit — run, as-designed and current slope, joint-stress index, classification, evidence count.

This is what keeps the firm inside its scope of practice: the measurement leaves, the judgment stays with the person licensed to make it.

Why the numbers hold up

Computed the way an engineer would check it.

A template fills in blanks. This computes, and then it shows its work — because the first thing a reviewing engineer does is try to break your arithmetic.

Every chord is searched, not sampled

ASCE Texas Section § 5.4 defines the deflection ratio as the maximum deviation of a third point from a straight line between two points, divided by the distance between them. Every pair of plan-located points is searched as a candidate chord and the governing — worst — triple is the one reported. The report names it: “0.54 in. deviation at M-08 from the 16.2 ft chord M-03 to M-11.” Not the pair that happened to look bad on site.

Tilt is reported separately, from a best-fit plane

A house can lean without bending. Tilt is rigid-body rotation; deflection is bending, and only bending cracks brick. Reporting them as one number is the most common error in foundation documentation. Here they are two numbers — tilt taken from a least-squares best-fit plane through every plan-located point, printed on its own line beside the deflection ratio.

The conventions are disclosed, not buried

Where the tool makes a judgment the standard does not dictate — the chord-acceptance tolerance, the severity banding — the report says so in its own text: an intermediate point is accepted when it falls within 10 percent of the chord length in plan, “which is this tool’s search convention and not a figure from the guidelines.” Of the severity bands it says they “do not establish distress, and they assert nothing about cause.” A reviewer can accept that, adjust it, or reject it. What they cannot do is be misled by it.

Datum shift is removed before movement is claimed

A relative survey carries no absolute benchmark, so each visit is reduced to deviations from its own reference point. When two visits are compared, the change of datum is subtracted from every figure — reported as a separate column — so what survives is the change in shape of the structure, not the arbitrary zero you started from.

The slope profile is drawn, segment by segment

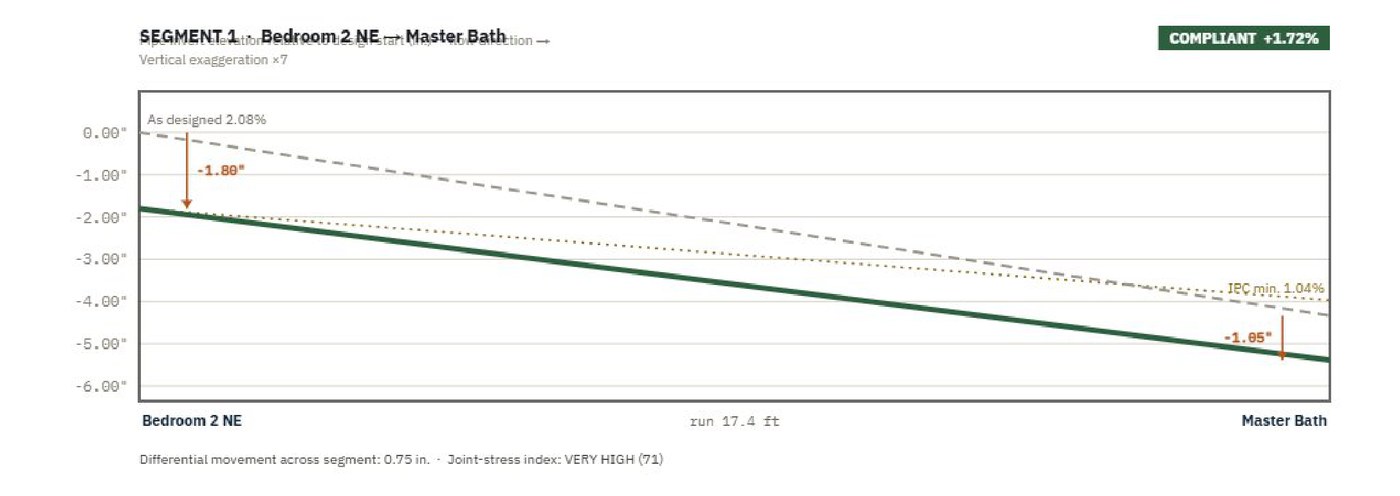
Side-view slope profile for one sewer segment: as-designed slope, current slope computed from measured settlement, and the IPC minimum reference line.

As-designed slope, the current slope computed from measured settlement at each end, and the IPC minimum, on one axis. Vertical scale is exaggerated for readability and the exaggeration factor is printed on every profile — so nobody mistakes the drawing for the magnitude.

The plumbing figure is a triage order, not a verdict

The joint analysis ranks which sewer segment to test first — from measured differential settlement, the joint tolerance of the pipe material and the installation era. It tells a crew where to put the camera. It is not a leak test and does not replace one: the report is a reason to test, never a substitute for testing.

Every threshold traces to a published source

Drain slope minimums come from IPC Table 704.1 and IRC Table P3005.3 — ¼ in./ft for 2½ in. and smaller, ⅛ in./ft for 3–6 in. Evaluation method comes from the ASCE Texas Section Guidelines, Version 3, adopted 1 April 2022 — cited by edition in the report’s own reference list. Nothing in the report is a number this firm invented.

Where the evidence comes from

Federal soil data. A calibrated instrument. Both on the record.

Published survey data

Published soil survey data

Site geology is recorded in § 2.3 and printed in the report: soil map unit and dominant component, shrink–swell potential, plasticity index, linear extensibility and drainage class. On the sample property that reads Houston Black clay, map unit HuB, shrink–swell Very High, PI 40–60, LEP 9.5% — so a reviewer can see what the analysis assumed about the ground.

Cited for regional context. The report says outright that this is not a parcel-specific geotechnical determination — that requires a site-specific study by qualified professionals.

Instrument provenance

ZipLevel PRO-2000

Every report logs the instrument, its serial number, its calibration date, its stated accuracy (±0.05 in.), the unit and the reference mode. A reading with no instrument history behind it is an anecdote. A reading with a serial and a calibration date is a measurement.

This is the section a reviewing engineer or an opposing expert turns to first. It is filled in every time, because the tool will not let it be skipped.

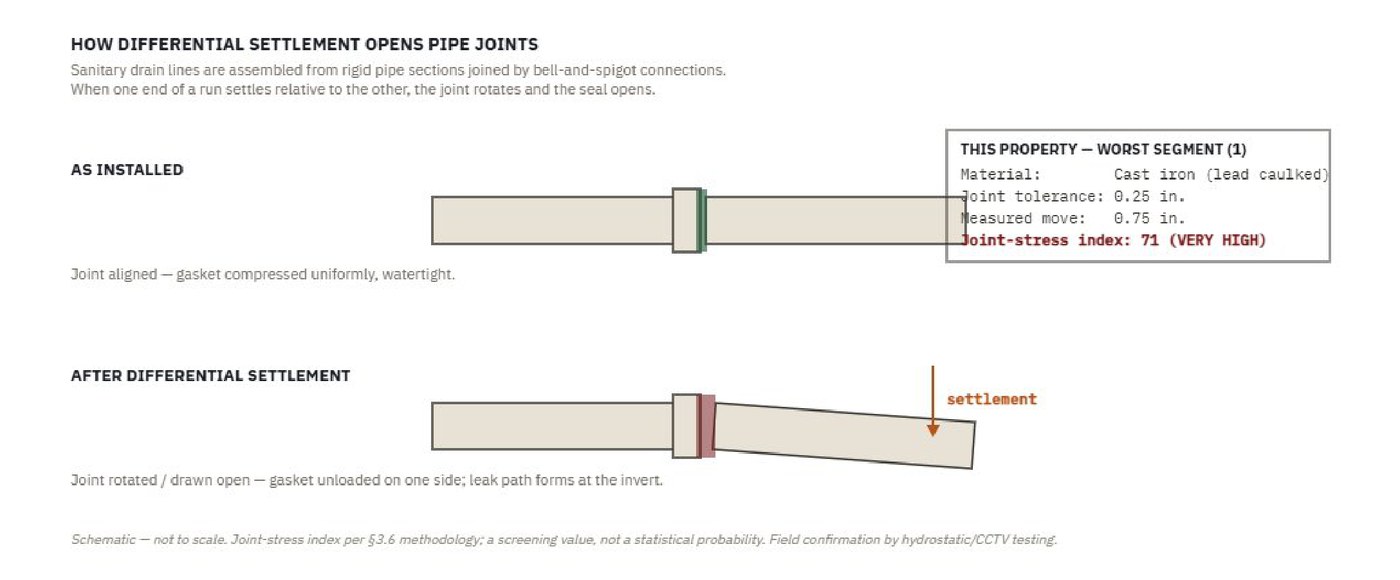
Schematic of a bell-and-spigot drain joint as installed and after differential settlement, with this property's worst-segment material, joint tolerance, measured movement and joint-stress index.
Exhibit C — how differential settlement opens a bell-and-spigot joint, annotated with this property's own worst-segment values: material, joint tolerance, measured movement, resulting index.

Nothing is invented. Missing readings, missing license details and missing calibration dates are flagged for you to supply — never filled in by the tool. That single rule is what makes the rest of the document worth anything.

Part II · bound into every report

The half your customer actually reads.

The technical sections are for the engineer, the adjuster and the file. Part II is written for the person standing in the kitchen deciding whether to believe you — plain language, one map, and a numbered list of what happens next.

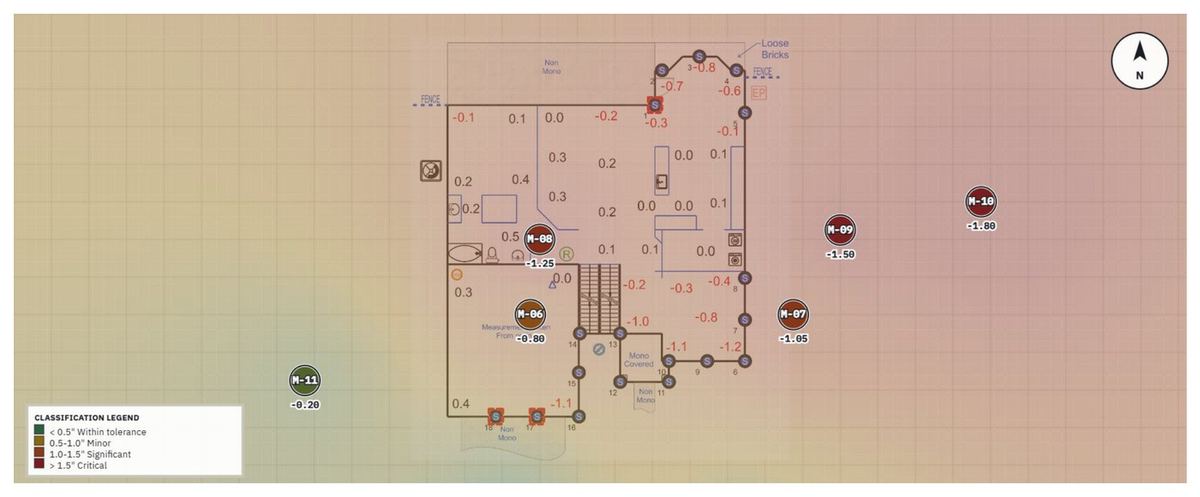
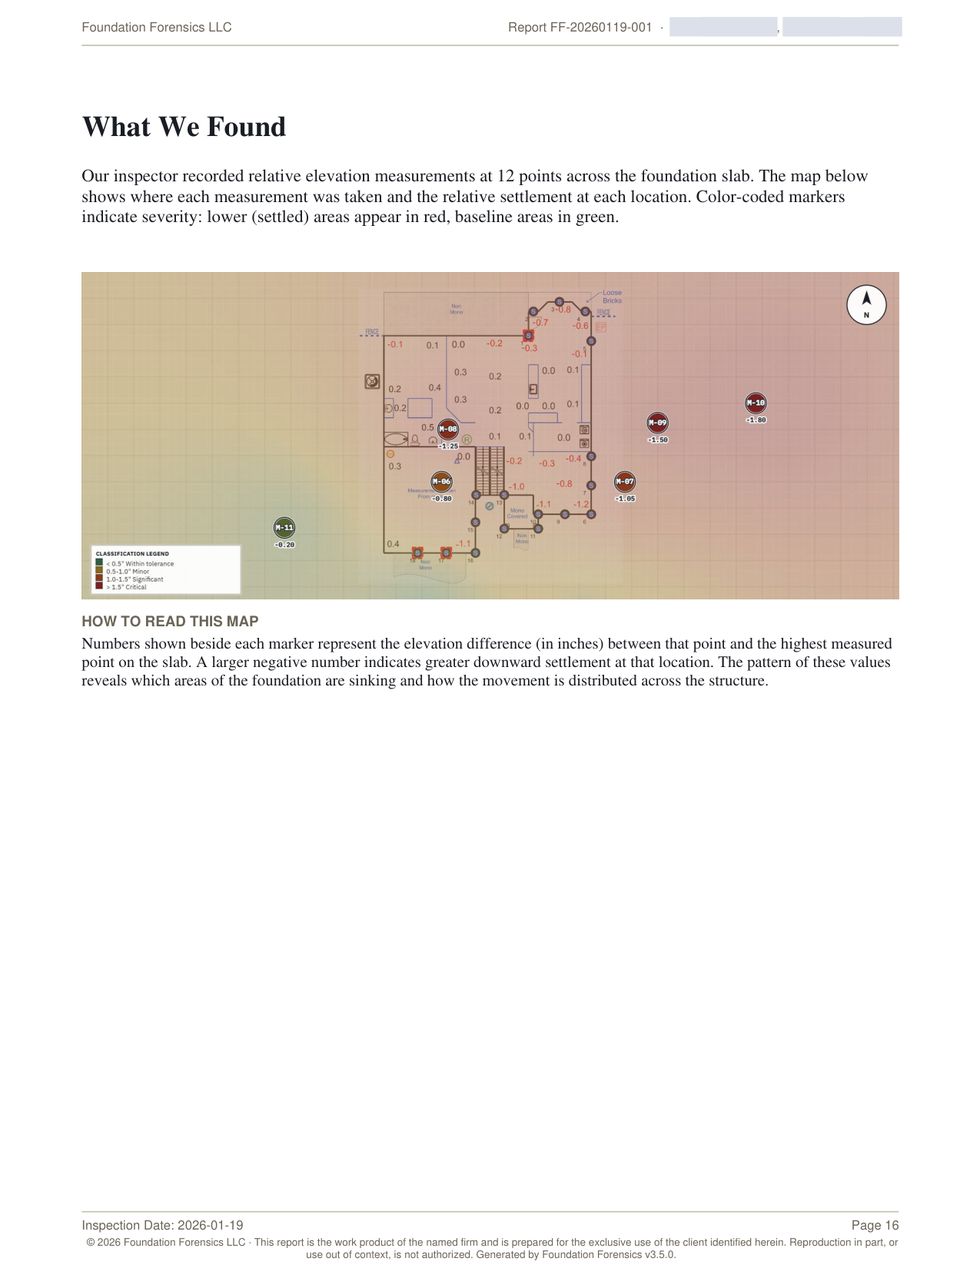
Homeowner-facing settlement map: floor plan with colour-coded severity markers showing the elevation difference in inches at each measurement point, with a classification legend and north arrow.
"What We Found" — the same measured field, drawn for someone who has never read an engineering report. Markers carry the number; colour carries the severity.
What We Found page with the settlement map and a how-to-read-this-map explanation.
What We Found — and how to read it.
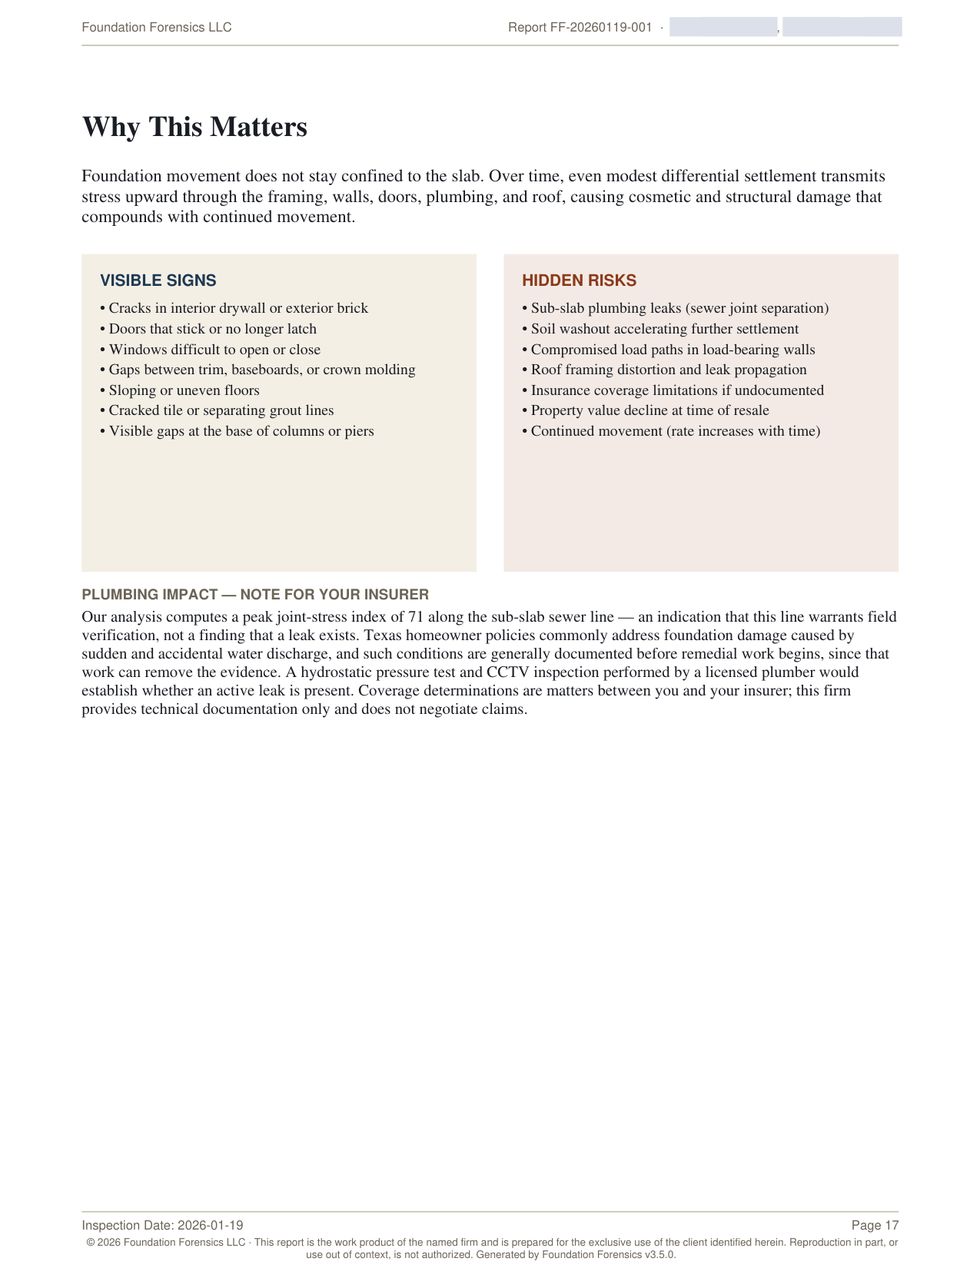
Why This Matters page listing visible signs and hidden risks, with a note for the insurer.
Why This Matters — visible signs vs hidden risks.
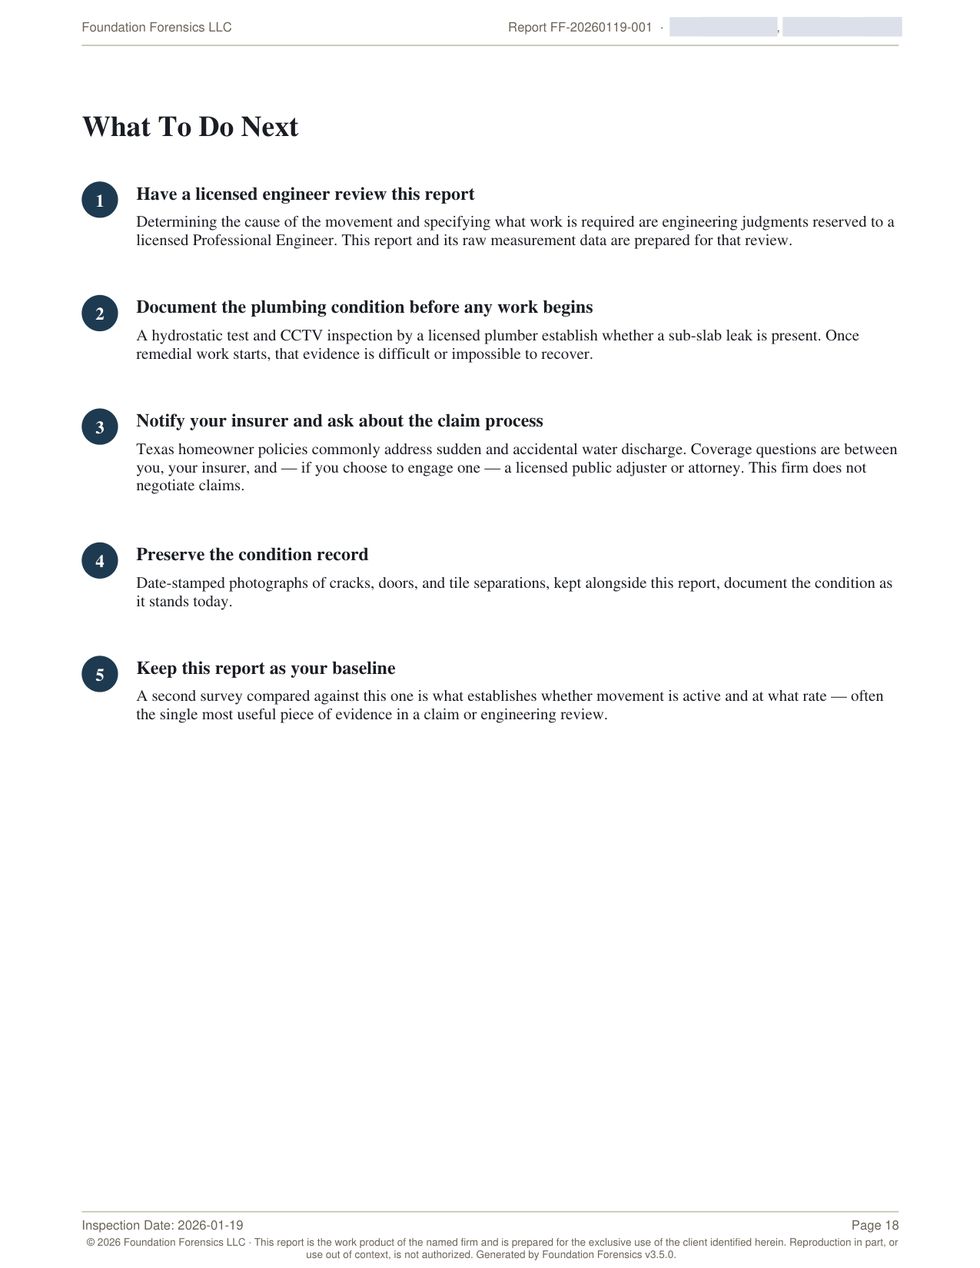
What To Do Next page with five numbered steps.
What To Do Next — five steps, in order.
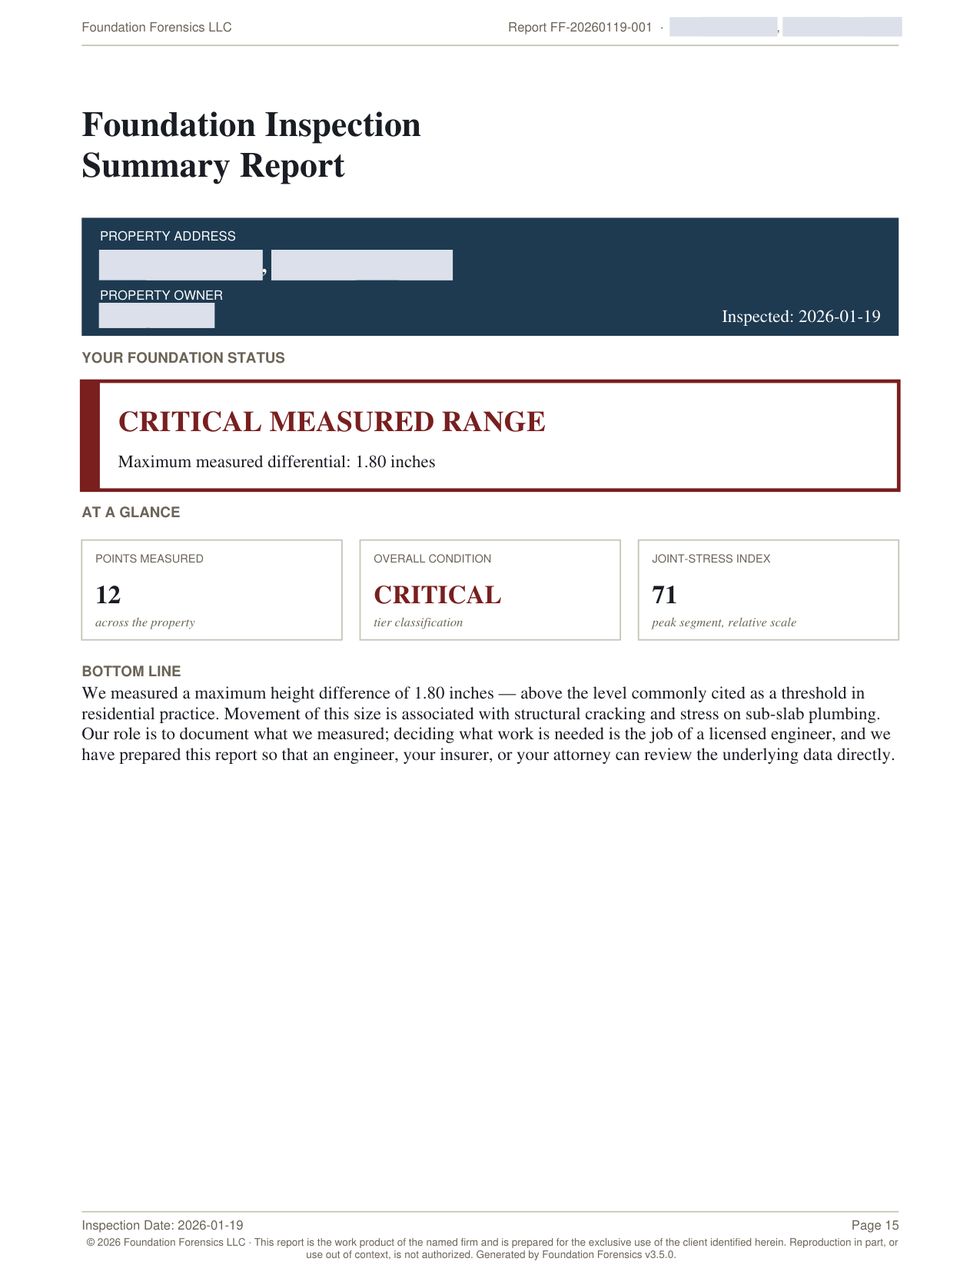
Owner summary page with foundation status and at-a-glance metrics.
Status at a glance, in one line.

This is the part that gets forwarded — to a spouse, an insurer, a second contractor. It carries your name on it.

What it does for you

It tells you what to do next — and what isn't yours to do.

Most contractors already know what they found before they leave the property. What they don't always have is a defensible next step, written down, in the right order.

01Which test, and why that one

Hydrostatic pressure test and CCTV inspection by a licensed plumber; comparative re-survey at a defined interval to establish whether movement is active and at what rate; soil moisture sampling at the perimeter if an engineer determines it material. Each tied to the specific open question it answers.

02Which segment to test first

The joint-stress index ranks the sewer run so the plumber's scope goes where the measured differential is worst — instead of scoping the whole line and hoping.

03Where your authority ends

Causation and remedial scope are engineering judgments reserved to a licensed P.E. under Texas Occupations Code Ch. 1001. The report states that in its own scope section — which protects you as much as it protects the homeowner.

04Sequence that preserves the record

Verification testing before remedial work both preserves the evidentiary record and establishes whether an active leak is a contributing factor. Do it in the other order and the question can never be answered.

Built for Texas

Texas clay doesn't forgive.

Expansive soils swell and shrink with every wet season and drought. That movement shows up as stair-step cracks in brick, doors that stop latching, and floors that read an inch out of level across 20 feet.

Stair-step cracksCracking that follows the mortar joints in brick or block.
Doors that stop latchingThe frame racking out of square as the slab moves under it.
Floors out of levelMore than 1 inch of difference across a 20-foot span.

None of these proves failure on its own. Together with elevation readings, they build a case — and that case is what the report is for.

Scope, stated plainly

The report says what it is — and what it isn't.

What the report does

  • Documents measured conditions as of the survey date
  • Computes deflection, tilt and per-segment drain slope from those measurements
  • Cites published soil survey data for regional context
  • Bands the measured differential on a stated, consistent convention
  • Prepares the record for review by an engineer, an adjuster, or counsel

What it does not do

  • Render an engineering opinion as to causation
  • Specify corrective work or remedial scope
  • Certify structural adequacy or code compliance
  • Substitute for a geotechnical study or plumber's field test
  • Negotiate insurance claims

Determination of cause is an engineering judgment reserved to a licensed Professional Engineer under Texas Occupations Code Chapter 1001. Drawing that line clearly is what makes the measured record usable by the engineer who reviews it.

Platform tier

Seven things a template cannot do.

The agent writes the report. The platform is the working instrument behind it — for crews running monitoring intervals and building an evidentiary record over time.

  • Relative elevation surveyLive calculation against residential thresholds as each point is entered — not after you get back to the office.
  • Plan-view renderingSettlement bands and iso-settlement contours drawn from your points, so the shape of the movement is visible.
  • Sub-slab plumbing impactPer-segment slope computed against IPC / IRC minimums, with a joint-stress screening index by pipe material and era.
  • Multi-visit monitoringRe-survey against a baseline with the datum shift removed, reporting movement rate in inches per month.
  • Field-test evidenceCCTV, hydrostatic and smoke-test results attach to the specific segment they belong to, not to the report generally.
  • Site geologyUSDA NRCS published soil survey pulled per parcel, with an embedded offline database when there's no signal.
  • Raw-data CSV exportThe underlying numbers leave with the report, so a reviewing engineer can check the arithmetic themselves.

Runs where the work is

No install. No account. No server.

A single file that opens in the browser you already have. Your data stays in local storage on your own device, and the PDF engine is bundled — so a crawlspace with no bars is not a problem, and no client's address is ever sitting on someone else's server.

  • Single fileNothing to deploy or update
  • Local storageData never leaves the device
  • Bundled PDF engineGenerates the report offline
  • CSV exportYour numbers stay portable

What you are actually buying

Standing.

Not a faster way to type. The difference between "the contractor said the slab is moving" and a measured record, on a published standard, that an engineer can pick up and review.

Without it

  • Readings on a legal pad, retyped into a template
  • Severity asserted, not derived
  • No instrument, no serial, no calibration date
  • Soil described from memory of the neighbourhood
  • Nothing to hand an adjuster that survives a second reading

With it

  • Every point coded, with delta and status
  • Deflection and tilt computed, method stated
  • Instrument, serial, calibration date on the record
  • USDA NRCS survey data cited with its retrieval date
  • A document built to be reviewed, and to hold when it is

One report that does not hold up costs more than a year of this. Not in fees — in the job you do not get called back for, and the homeowner who tells three neighbours. The documentation is the part of the work that outlives the visit.

What we found in our own work

The audit we published against ourselves.

In August a verification pass recomputed the calculation engine from scratch, independently of the code that produced it. It found five things wrong. We fixed them and wrote down what they were, because a measurement tool that has never been audited is just a tool nobody has checked yet.

  1. v3.4.0
    Tilt was being reported as deflection

    The engine computed elevation range over a span, called it deflection, and classified it against L/360 and L/240 — which are bending limits. A slab that was flat but out of level read as bent. Deflection is now the departure from a least-squares plane; tilt is reported separately as that plane's gradient.

  2. v3.4.0
    Plan scale was hardcoded at 20 px/ft

    And duplicated as a bare 0.05 in two other places. Every segment run and every span depended on it. § 3.5.2 calibration was added, and until it runs the report says its lengths are assumptions.

  3. v3.4.0
    Five implementations of "reference elevation" disagreed

    Screen, PDF and CSV export could each show a different number. There is one function now.

  4. v3.3.0
    § 7.0 never printed in the PDF

    The flagship multi-visit feature existed on screen only. It prints now — and cross-visit datum shifts are normalised before differencing, so a change of survey reference can no longer masquerade as structural movement.

  5. v3.5.0
    Deflection ratio did not match the guideline definition

    Peak-to-trough measurement was replaced with the ASCE § 5.4 chord construction. Threshold tiers that do not appear in the source guidelines were removed rather than kept for convenience.

Read the whole history in the changelog. A vendor who will not tell you what they got wrong has not stopped getting things wrong.

See plans